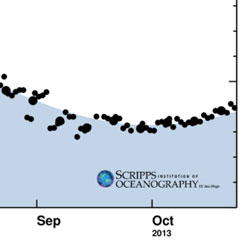
The rate of growth in carbon dioxide concentrations in the atmosphere has accelerated since the beginnings of the Keeling Curve.
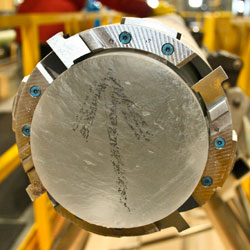
New Study Shows Three Abrupt Pulses of CO2 during Last Deglaciation
Breakthrough after field project collects richly detailed ice core records from Antarctica
Wendy and Eric Schmidt Award $500,000 Grant to Keeling Curve
Supports continued operation of the iconic measurement series
As Told by the American Museum of Natural History…
The story of the Keeling Curve is beautifully animated in this new video. The American Museum of Natural History will host a Google+ Hangout Sept. 9, 2014 on the topic of the Keeling Curve. [youtube https://www.youtube.com/watch?v=0Z8g-smE2sk&w=560&h=315]
How are CO2 Data Processed?
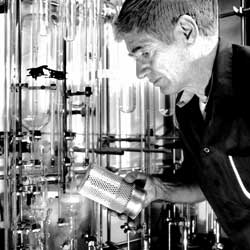
Scientists make CO2 measurements in remote locations to obtain air that is representative of a large volume of Earth’s atmosphere and relatively free from local influences that could skew readings.
How do CO2 levels relate to ice ages and sea-level?
In a recent comment, a reader posted a graphic in which CO2 and sea-level rise appear to be correlated throughout the last 700,000 years.
What Does 400 ppm Look Like?

As atmospheric carbon dioxide levels rise, scientists look back four million years for answers on what to expect from climate
How Much CO2 Can The Oceans Take Up?
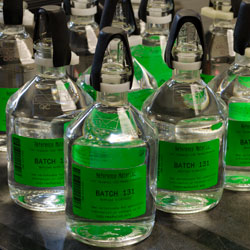
A companion phenomenon of emitting CO2 into the atmosphere is the loading of the oceans with elevated levels of carbon dioxide created by fossil fuel burning and other human activities.
Why Does Atmospheric CO2 Peak in May?

Tim Lueker, research scientist in the Scripps CO2 Research Group, only needs one sentence to explain why atmospheric CO2 peaks in May.