 Scientists make CO2 measurements in remote locations to obtain air that is representative of a large volume of Earth’s atmosphere and relatively free from local influences that could skew readings. The quality of data is verified before daily average values are determined.
The Mauna Loa record is usually shown with one point per month, using monthly averages. Finer details of the recent record including hourly, daily, and weekly averages, are displayed on the home page of this site.
The data shown in this site are preliminary, pending recalibrations of reference gases and other quality control checks.
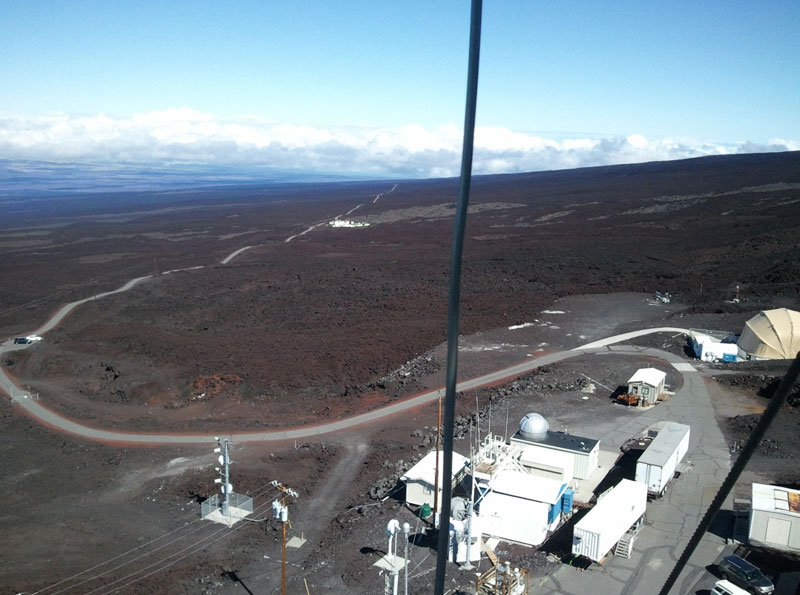
With an elevation of 3,397 meters (11,145 feet) over the Pacific Ocean, the Mauna Loa Observatory is typically bathed in air that is representative of a large volume of the Earth’s atmosphere. There is no vegetation at the barren lava-strewn site and the effects of the volcano are usually small. The air at the observatory is often influenced, however, by afternoon updrafts from lower elevations where lush vegetation is present. During the day, the vegetation tends to take up CO2 by photosynthesis. To provide a record that is characteristic of the free atmosphere over the Pacific, it is necessary to screen the data to avoid the influences of vegetation or other island effects.
The daily values we report are therefore not simple averages of hourly data, but averages of “baseline data”, i.e. hourly data that have been screened to avoid island effects. The island effects can usually be distinguished because they tend to cause short-term fluctuations in CO2 concentration. To avoid these effects, we select only data from periods when the CO2 concentrations are relatively stable. Our baseline selection criterion looks for periods at least 5 consecutive hours when the (within) hourly standard deviations are all less than 0.15ppm and when the hourly averages all agree to within 0.22pmm of each other. In addition, we exclude periods in the afternoon that otherwise satisfy the baseline criterion if the CO2 concentrations are notably lower than other recent baseline periods. This afternoon screening is necessary to adequately eliminate the effects of vegetation at lower elevations.
More information on baseline data selection can be found on the Scripps CO2 program website.
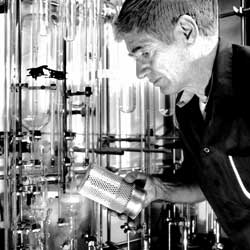
Over the 55 (and counting) years of recording the Keeling curve, there have been upgrades and additions to the CO2 measurement program at the Mauna Loa Observartory. The original infrared analyzer built by the Applied Physics Co. (APC) and installed by Keeling in 1958, was operated (mostly) continuously until February 2006, when the Scripps CO2 program upgraded to a new infrared analyzer built by the Siemens Co. Data were collected in parallel on both the APC and Siemens analyzers for one year to insure the integrity of the Keeling Curve prior to the changeover.
In 1974, NOAA instituted a global program of monitoring CO2 and other gases under the direction of Lester Machta. At that time, a second CO2 analyzer system was installed at Mauna Loa which has continued to operate in parallel with the Scripps instrument.
The Scripps instrument itself has seen several upgrades. The original Scripps Applied Physics analyzer was retired in 2006 when it was replaced by a more modern CO2 analyzer made by Siemens after a year of overlap. A further upgrade is currently underway in a collaboration between Scripps and Earth Networks Corp. using an even newer technology based on cavity ring-down (CRD) spectroscopy. The CRD instrument was installed in December 2012 and has operated in parallel with both the Siemens and the NOAA analyzers. The plan is to retire the Siemens analyzer by the end of 2013 after a year of overlap with the CRD instrument. Typically the CO2 concentrations independently determined from all three analyzers agree within a few tenths of a ppm (0.2 to 0.3 ppm).