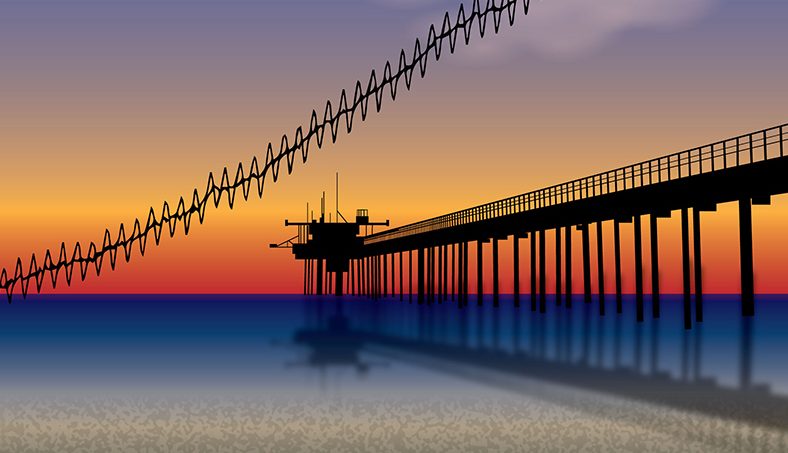
A correspondent recently asked Keeling Curve researchers to settle a family disagreement about the cause of rising CO2 levels in the atmosphere and whether the current trend is natural or human-caused. Scripps geochemist Ralph Keeling provided the following answer:
New Study Shows Three Abrupt Pulses of CO2 during Last Deglaciation
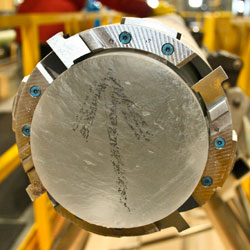
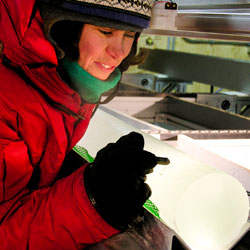
Breakthrough after field project collects richly detailed ice core records from Antarctica
How do CO2 levels relate to ice ages and sea-level?
In a recent comment, a reader posted a graphic in which CO2 and sea-level rise appear to be correlated throughout the last 700,000 years.
How are ice-core data and Mauna Loa atmospheric data made comparable?
Some readers of the Keeling Curve website have asked us about the graphs that show carbon dioxide concentrations since 1700 and over the past 800,000 years, which use a combination of data derived from analysis of the gas contained in ice cores and that obtained from air sampled at Mauna Loa Observatory in Hawaii.
What Does 400 ppm Look Like?
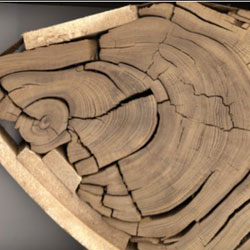
As atmospheric carbon dioxide levels rise, scientists look back four million years for answers on what to expect from climate


