The rate of growth in carbon dioxide concentrations in the atmosphere has accelerated since the beginnings of the Keeling Curve.
How are CO2 Data Processed?
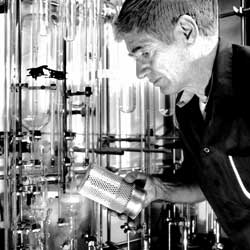
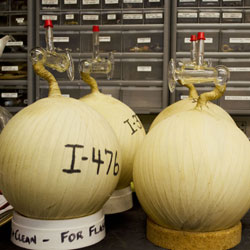
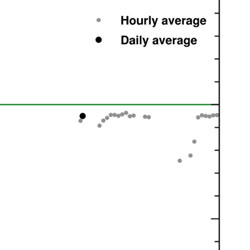
Scientists make CO2 measurements in remote locations to obtain air that is representative of a large volume of Earth’s atmosphere and relatively free from local influences that could skew readings.
How do CO2 levels relate to ice ages and sea-level?
In a recent comment, a reader posted a graphic in which CO2 and sea-level rise appear to be correlated throughout the last 700,000 years.
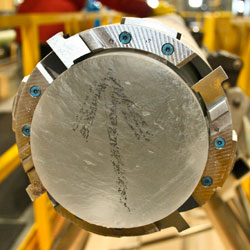
How are ice-core data and Mauna Loa atmospheric data made comparable?
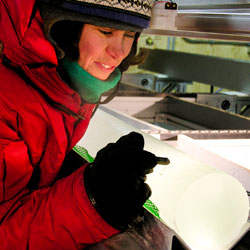
Some readers of the Keeling Curve website have asked us about the graphs that show carbon dioxide concentrations since 1700 and over the past 800,000 years, which use a combination of data derived from analysis of the gas contained in ice cores and that obtained from air sampled at Mauna Loa Observatory in Hawaii.
Why Does Atmospheric CO2 Peak in May?

Tim Lueker, research scientist in the Scripps CO2 Research Group, only needs one sentence to explain why atmospheric CO2 peaks in May.
Why are Seasonal CO2 Fluctuations Strongest at Northern Latitudes?

The farther north a CO2 reading is made, the wider it swings with the seasons
Why Daily Readings are Sometimes Unavailable
Many readers noticed that there were several days without readings recently.