 Some aspects of CO2 analysis require old-school methods
“Hold your breath and walk into the wind, then open the valve.”
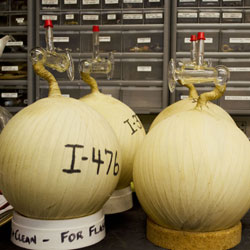
Cradling a glass globe wrapped in what looked like medical tape, Tim Lueker, a researcher in the CO2 Research Group at Scripps Institution of Oceanography, UC San Diego, described the protocol for air sampling using a “Keeling” flask.
About every two weeks, when the winds are right, someone from the CO2 Group walks to the end of Scripps Pier and fills these strange bottles with air. This time- and labor-intensive process takes place a few feet away from where high-tech, automated carbon dioxide (CO2) sensing instruments are installed. Amazingly, these air samples are collected in the same manner, and even using some of the same flasks, as when Charles David “Dave” Keeling began collecting air samples for CO2 analyses 58 years ago. Why do scientists still perform this slow and laborious air sampling routine?
The answer is that the air collected in these bottles is used to gather detailed information on carbon cycling and fossil fuel emissions by measuring not only the CO2 concentration but also the relative abundance of the carbon isotopes 12C, 13C and 14C.
Scripps Pier is one of several sampling sites around the world, including the Mauna Loa Observatory in Hawaii operated by NOAA, where CO2 air samples are collected and shipped periodically to the Scripps Institution of Oceanography CO2 program. The program is now led by Scripps geochemist Ralph Keeling, Dave Keeling’s son.
Tim Lueker has a special connection to the program, as he was Dave Keeling’s last Ph.D. student.
“Coincidentally, Dave died a few weeks after I left Scripps in 2005,” said Lueker, who returned to Scripps in 2012 to work in the Keeling lab. Periodically Lueker checks the wind direction and local CO2 concentrations at the pier. The conditions for sampling clean “background” air are met when the wind is coming off the ocean. If the wind is coming from over land, there will be elevated CO2 concentrations from local sources, such as automobiles and power plants.
You also need to make sure that there’s no air in [the flask] from when it was packed in the lab, or from the breath of the person who’s sampling, said Lueker. That’s why holding your breath is part of the sampling procedure and why the flasks are evacuated with a vacuum line before sampling. The tape around the bottle is for safety; it restrains the broken glass if the evacuated bottle implodes.
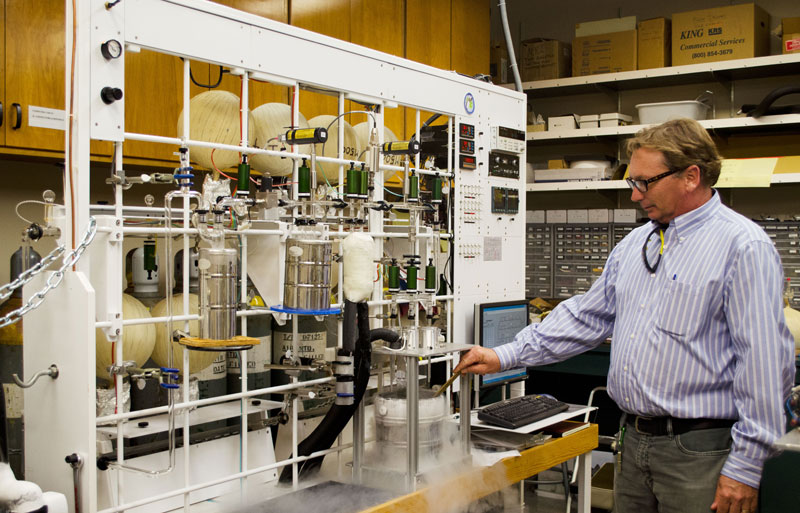
Flasks from Mauna Loa, Antarctica, near the North Pole, and other monitoring sites are shipped to the Keeling Lab where the CO2 is quantified and then extracted for isotope analysis. Samples are run through a complex array of tubing, valves, and steaming “traps” of liquid nitrogen where water vapor, oxygen, nitrogen, and other trace gases are separated from the CO2. The isolated CO2 is collected in a glass capillary tube and subsequently analyzed for 13C and 14C isotope content.
The carbon in CO2 is a mixture of isotopes—atoms with the same number of protons and electrons, but a different number of neutrons. The most common carbon isotope is 12C, which makes up about 98.9 percent of all naturally occurring carbon. The remaining is mostly 13C, 1.1 percent, and 14C, which is only present in trace amounts, around 0.0000000001 percent.
Scientists distinguish the different isotopes using a mass spectrometer, a device that turns a chemical sample into a beam of ions (molecules or atoms that are charged) and then utilizes a magnetic field to deflect the ions to varying degrees, with heavier ions deflected less than lighter isotopes due to their greater inertia. By counting the ions that emerge from the magnetic field at different positions scientists can then quantify the isotopic species that are present in a sample.
Along with a steady upward trend, Dave Keeling found that the CO2 concentrations in the Northern Hemisphere followed a “saw-tooth” pattern, with one peak and one valley every year. Keeling attributed this variation to land plants taking up carbon by photosynthesis in the summer, and decomposing and releasing it in the winter. This oscillation was absent in the Southern Hemisphere, he proposed, because there are many more land plants in the north. To bolster the case for this mechanism, Keeling turned to isotopic measurements. Plants preferentially take up 12C over 13C, leaving CO2 remaining in the atmosphere enriched in 13C. Keeling showed that exactly the expected pattern was present in the isotopes of CO2: as the CO2 concentration decreased in the summer, the 13C/12C ratio of the CO2 rose, and by the right amount.
Dave Keeling did not have a mass spectrometer when he started measurements at Scripps. For the isotope work, he had to rely on measurements made some years earlier during his postdoctoral fellowship at California Institute of Technology in Pasadena, Calif. But he had always wanted to include isotope measurements along with CO2 concentration measurements. In the late 1970s he was able to realize this goal through a collaboration with Wim Mook of the University of Gronigen in the Netherlands, where he shipped CO2 samples. This arrangement continued until 1991, when isotopic measurements also began at Scripps.
Today, after extraction in the Keeling Lab, some CO2 samples are shipped to the Lawrence Livermore National Laboratory, where they are analyzed for 14C.
14C is radioactive, meaning that it decays over time, from 14C to14N. The half-life of 14C is about 5,700 years (meaning half of the 14C in a sample will have decayed after 5,700 years). Atmospheric CO2 naturally contains a small amount of radiocarbon, because it is constantly being produced in the atmosphere by nuclear reactions triggered by cosmic rays. In contrast, CO2 from fossil fuel emissions doesn’t contain any 14C, because the original radiocarbon content in the plant matter that formed the fuel has long since decayed. As more and more CO2 is emitted into the atmosphere from the burning of fossil fuels, the amount of 14C in the atmosphere is decreased by “dilution” with 12C and 13C. Measuring the 14C abundance in the atmosphere over time provides a more detailed picture of carbon sources and sinks, and can be used to distinguish anthropogenic emissions from biogenic emissions, as only anthropogenic emissions are completely free of 14C.
CO2 concentration and isotopic data, gathered from all around the world for so many years, paint an intricate picture of the human influence on the atmosphere. The data clearly show that CO2 concentrations are rising, and this rise can only be attributed to burning fossil fuels.
“CO2 concentrations probably haven’t been this high for over 3 million years,” Lueker said, “Last time, the CO2 built up over thousands of years, and now it’s happening in an instant. It seems so obvious that there are going to be consequences when we are dumping so much stuff into the atmosphere.”
– Mallory Pickett is a master’s student in the lab of chemical oceanographer Andreas Andersson at Scripps Institution of Oceanography, UC San Diego
Related photos:
[slickr-flickr search=”sets” set=”72157633529867081″ descriptions=”on”]