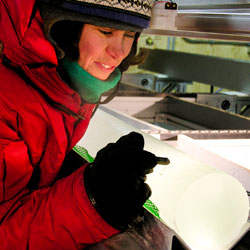
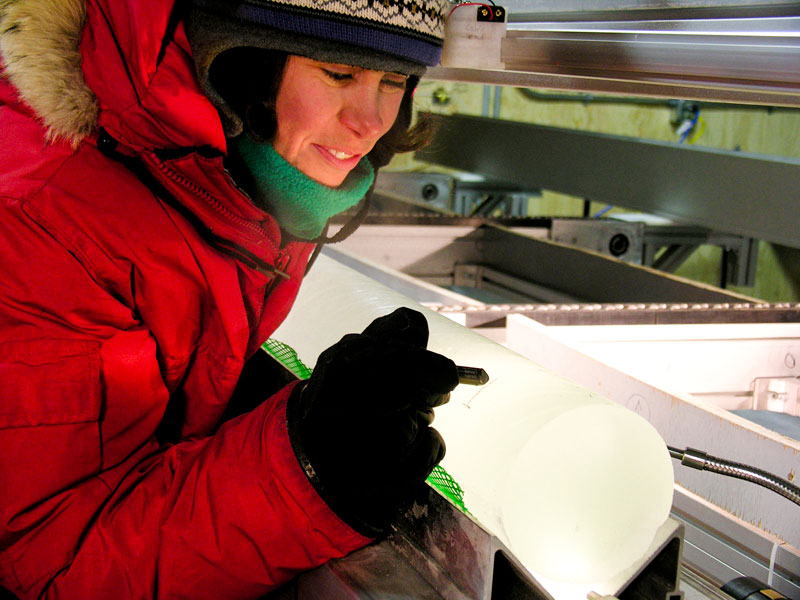
An ice core extracted from the West Antarctica Ice Sheet
Some readers of the Keeling Curve website have asked us about the graphs that show carbon dioxide concentrations since 1700 and over the past 800,000 years, which use a combination of data derived from analysis of the gas contained in ice cores and that obtained from air sampled at Mauna Loa Observatory in Hawaii.
“For me they seem quite different measurement tools, so how is it possible that they are merged into one single graph?” asked one.
On the ice core question, it turns out that the ice core reconstructions overlap with the first couple decades of the South Pole record of atmospheric CO2 made by Scripps Institution of Oceanography, UC San Diego scientists, and the overlap shows very good agreement. Also, ice core records recovered from different locations in Antarctica agree quite well with each other. Both of these facts demonstrate that the ice cores are recording atmospheric composition quite faithfully.
The main limitation of the ice-core data is that it is effectively a 10-year or longer running average, because air of slightly different ages is mixed together in firn layers – layers of compacted snow that falls in one year and survives unmelted to the following year – before the air is sealed off into bubbles in the ice layers below the firn. The ice-core record therefore not as sharp in time as the direct atmospheric record, but it’s plenty sharp enough to document changes decade by decade, and therefore the rise from preindustrial times towards the present.