The rate of growth in carbon dioxide concentrations in the atmosphere has accelerated since the beginnings of the Keeling Curve.
New Study Shows Three Abrupt Pulses of CO2 during Last Deglaciation
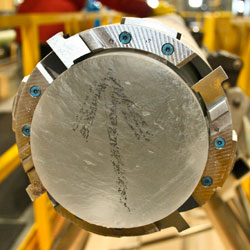
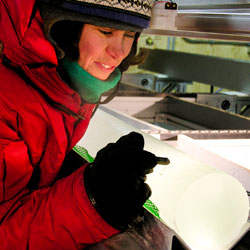
Breakthrough after field project collects richly detailed ice core records from Antarctica
Wendy and Eric Schmidt Award $500,000 Grant to Keeling Curve
Supports continued operation of the iconic measurement series
As Told by the American Museum of Natural History…
The story of the Keeling Curve is beautifully animated in this new video. The American Museum of Natural History will host a Google+ Hangout Sept. 9, 2014 on the topic of the Keeling Curve. [youtube https://www.youtube.com/watch?v=0Z8g-smE2sk&w=560&h=315]
A note on recent readings
In response to a recent reader comment about wide fluctuations in CO2 readings at Mauna Loa, Ralph Keeling and Stephen Walker of the Scripps CO2 Group gave the following answer: It’s fairly normal, especially in the summer time, to see strong afternoon “dips” in the CO2 concentration. The dips are generally caused by upslope winds that that are depleted in … Read More
How are CO2 Data Processed?
Scientists make CO2 measurements in remote locations to obtain air that is representative of a large volume of Earth’s atmosphere and relatively free from local influences that could skew readings.
How do CO2 levels relate to ice ages and sea-level?
In a recent comment, a reader posted a graphic in which CO2 and sea-level rise appear to be correlated throughout the last 700,000 years.
How are ice-core data and Mauna Loa atmospheric data made comparable?
Some readers of the Keeling Curve website have asked us about the graphs that show carbon dioxide concentrations since 1700 and over the past 800,000 years, which use a combination of data derived from analysis of the gas contained in ice cores and that obtained from air sampled at Mauna Loa Observatory in Hawaii.
Comment on Recent Readings in Excess of 400 ppm
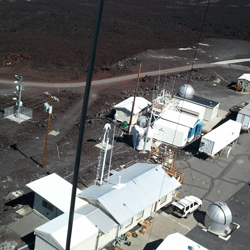
Instruments at the Mauna Loa Observatory in Hawaii recorded atmospheric levels of carbon dioxide greater than 400 parts per million on March 12, 2014 nearly two months earlier than the date on which the milestone was passed in 2013.
Why Don’t Global Surface Temperature Trends Match Atmospheric CO2 Increases?

Question submitted to Scripps Oceanography science magazine explorations now by Ruben M., Watsonville, Calif. Great question Ruben! The surface temperature we experience every day is not expected to perfectly track CO2 because CO2 isn’t the only factor driving climate change. Still, it is quite an important factor, and the overall rise in temperature does roughly follow the overall rise in CO2. … Read More