The Keeling Curve Navigation
  • History
  • Measurement Notes
  • FAQs
  • Videos
  • Other Climate Indicators
  • Search
  • History
  • Measurement Notes
  • FAQs
  • Videos
  • Other Climate Indicators
  • Search

Tag Archive

Home Posts mauna loa

The Annual Rise in CO2 Levels Has Begun

Robert MonroeOctober 23, 2013Measurement Notes

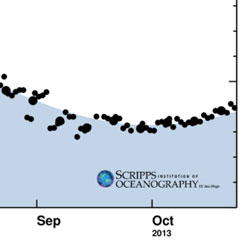
Could hit 400 parts per million in January 

Why Does Atmospheric CO2 Peak in May?

Robert MonroeJune 4, 2013FAQs, Measurement Notes

Tim Lueker, research scientist in the Scripps CO2 Research Group, only needs one sentence to explain why atmospheric CO2 peaks in May. 

Now What?

Robert MonroeMay 20, 2013Keeling Curve History

So we’ve reached 400 ppm.…  Now what happens?  

Why Scientists Still Collect CO2 in Flasks

Robert MonroeMay 20, 2013FAQs, Measurement Notes

Some aspects of CO2 analysis require old-school methods

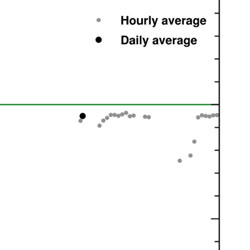
Why are Seasonal CO2 Fluctuations Strongest at Northern Latitudes?

Robert MonroeMay 7, 2013FAQs, Measurement Notes

The farther north a CO2  reading is made, the wider it swings with the seasons

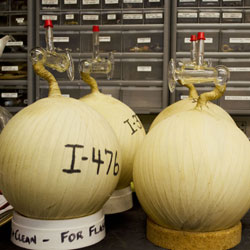
Why Daily Readings are Sometimes Unavailable

Robert MonroeApril 30, 2013FAQs, Measurement Notes

Many readers noticed that there were several days without readings recently.

  • Page 2 of 2
  • ←
  • 1
  • 2
  • History
  • Measurement Notes
  • FAQs
  • Videos
  • Other Climate Indicators
This site is a product of the Scripps CO2 Program

Scripps Institution of Oceanography, UC San Diego | Log In