There are multiple Jupyter notebooks, written in python, that open up in Google Colaboratory and enable customizations of graphics seen on the home page of the Keeling Curve website and additional notebooks that create animations of graphics. The notebooks create png and pdf files for graphics and mp4 files for animations. The notebooks are listed here.
The notebooks make use of archived data and the latest preliminary CO2 data from the Mauna Loa, Hawaii Observatory. Select notebooks make use of ice-core data going back 800K years. Each notebook contains a series of functions written in python which are used to fetch data and process it for creating and modifying plots and animations.
Examples of these modifications are found in this notebook notebook
Direct questions to webmaster-co2o2-sio@ucsd.edu
Running the notebooks
This page explains how to run the notebooks in Google Colab.
This sample notebook describes the functions in the notebook and what changes to make to change the appearance of the graphic.
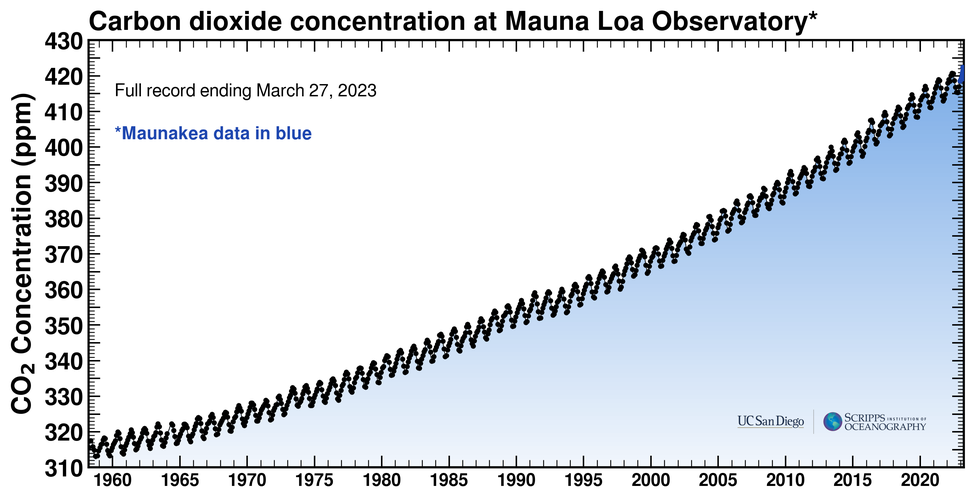
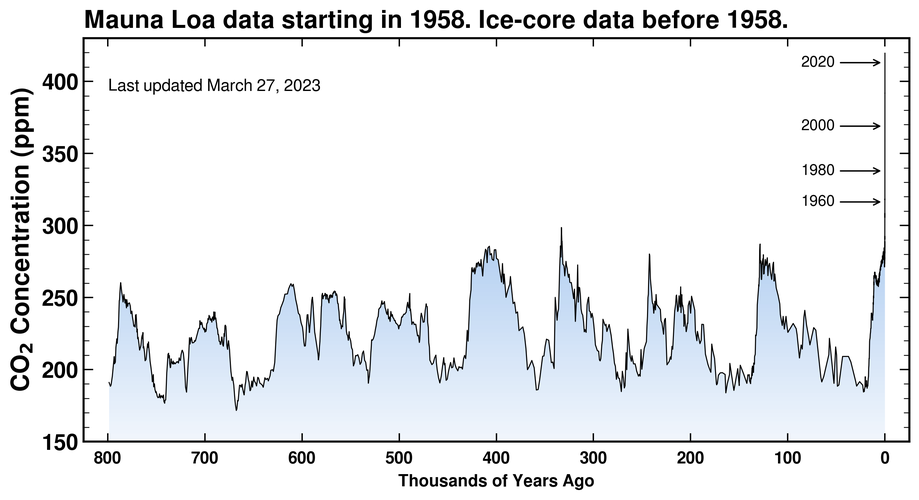
Sample of graphics generated by the notebooks
Supplemental Resources
Notebook Location
The notebooks listed above are stored in the Keeling Curve GitHub repository. The notebooks can be accessed there or from the notebook links on this page.
The notebooks can be accessed either from the table of contents notebook links or from the Keeling Curve GitHub repository.
From the Keeling Curve GitHub repository, the file links can be clicked on and this will open up a preview of the notebook.
Look for the Google Colab badge link at the top of each notebook. When this badge is clicked on, the notebook will open in Google Colaboratory where it can be run to generate graphics seen on the home page of the Keeling Curve website. All the code in the notebook can be modified without affecting the original version. And any changes can be saved to the user's Google Drive or the users GitHub repository.
GitHub Repository for the Jupyter notebooks
The notebooks listed above are stored in the Keeling Curve GitHub repository. The notebooks can be accessed there or from the notebook links on this page.
The notebooks can be accessed either from the table of contents notebook links or from the Keeling Curve GitHub repository. This repository contains Jupyter notebooks that open in Google Colab, a UCSD/SIO logo used in the MLO plots, and MLO data used to create the plots.
From the Keeling Curve GitHub repository, the file listing links can be clicked on and this will open up a preview of the notebook.
Look for the Google Colab badge link at the top of each notebook. When this badge is clicked on, the notebook will open in Google Colaboratory where it can be run to generate graphics seen on the home page of the Keeling Curve website. All the code in the notebook can be modified without affecting the original version. And any changes can be saved to the user's Google Drive or the users GitHub repository.
The data is updated when there is a tweet from the Keeling Curve twitter account which occurs nearly daily. Icecore data is fetched from https://www.ncei.noaa.gov. The last month of MLO data is preliminary and is subject to corrections due to factors discussed in the data sources section.
Notebooks and Data License
Data
The ice-core data going back 2K years and the Scripps CO2 program data in the Keeling Curve GitHub Repository are licensed under a Creative Commons Attribution 4.0 International License ![]() . For the ice-core data downloaded in the notebooks going back 800K years, see the data file for the data license.
. For the ice-core data downloaded in the notebooks going back 800K years, see the data file for the data license.
Notebook code
The code in https://github.com/sio-co2o2/keelingcurve_notebooks is licensed under the following:
BSD 3-Clause License
Copyright (c) 2023, Regents of the University of California, through the Scripps CO2 Program at SIO
Redistribution and use in source and binary forms, with or without modification, are permitted provided that the following conditions are met:
-
Redistributions of source code must retain the above copyright notice, this list of conditions and the following disclaimer.
-
Redistributions in binary form must reproduce the above copyright notice, this list of conditions and the following disclaimer in the documentation and/or other materials provided with the distribution.
-
Neither the name of the copyright holder nor the names of its contributors may be used to endorse or promote products derived from this software without specific prior written permission.
THIS SOFTWARE IS PROVIDED BY THE COPYRIGHT HOLDERS AND CONTRIBUTORS "AS IS" AND ANY EXPRESS OR IMPLIED WARRANTIES, INCLUDING, BUT NOT LIMITED TO, THE IMPLIED WARRANTIES OF MERCHANTABILITY AND FITNESS FOR A PARTICULAR PURPOSE ARE DISCLAIMED. IN NO EVENT SHALL THE COPYRIGHT HOLDER OR CONTRIBUTORS BE LIABLE FOR ANY DIRECT, INDIRECT, INCIDENTAL, SPECIAL, EXEMPLARY, OR CONSEQUENTIAL DAMAGES (INCLUDING, BUT NOT LIMITED TO, PROCUREMENT OF SUBSTITUTE GOODS OR SERVICES; LOSS OF USE, DATA, OR PROFITS; OR BUSINESS INTERRUPTION) HOWEVER CAUSED AND ON ANY THEORY OF LIABILITY, WHETHER IN CONTRACT, STRICT LIABILITY, OR TORT (INCLUDING NEGLIGENCE OR OTHERWISE) ARISING IN ANY WAY OUT OF THE USE OF THIS SOFTWARE, EVEN IF ADVISED OF THE POSSIBILITY OF SUCH DAMAGE.
Data and Graphics Usage Restrictions
Scripps CO2 program data on https://github.com/sio-co2o2/keelingcurve_notebooks and graphics created from the notebooks are licensed under a CC BY license, Creative Commons Attribution 4.0 International License ![]() , which clarifies appropriate uses and requirements. The graphics must be credited to the Scripps Institution of Oceanography at UC San Diego.
, which clarifies appropriate uses and requirements. The graphics must be credited to the Scripps Institution of Oceanography at UC San Diego.
For graphics which show ice-core data, additional credit must be given for these products, as appropriate for that source (see data sources section).
For applications supporting peer-reviewed scientific publications, ethical usage may also require disclosing intentions at early stages to avoid duplicating ongoing studies at Scripps or elsewhere. For such applications, coauthorship may sometimes be appropriate. An example would be if an important result or conclusion depends on this product, such as the first account of a previously unreported phenomenon.
Please direct queries to Ralph Keeling.
Data Sources and Citations
Data is "fetched", or downloaded for each notebook to generate the different graphics and animations. Data is either fetched from the Keeling Curve Github repository or downloaded from an outside data source.
See here for data sources and citations.