
In 2024, the yearly average level of the greenhouse gas carbon dioxide (CO2) rose faster over the prior year than ever before in the 67-year-old Keeling Curve record. When researchers took the average readings for all 12 months in 2024, the average was 3.58 parts per million (ppm) higher than for 2023’s average. That broke the record for largest jump … Read More
During Year of Extremes, Carbon Dioxide Levels Surge Faster than Ever
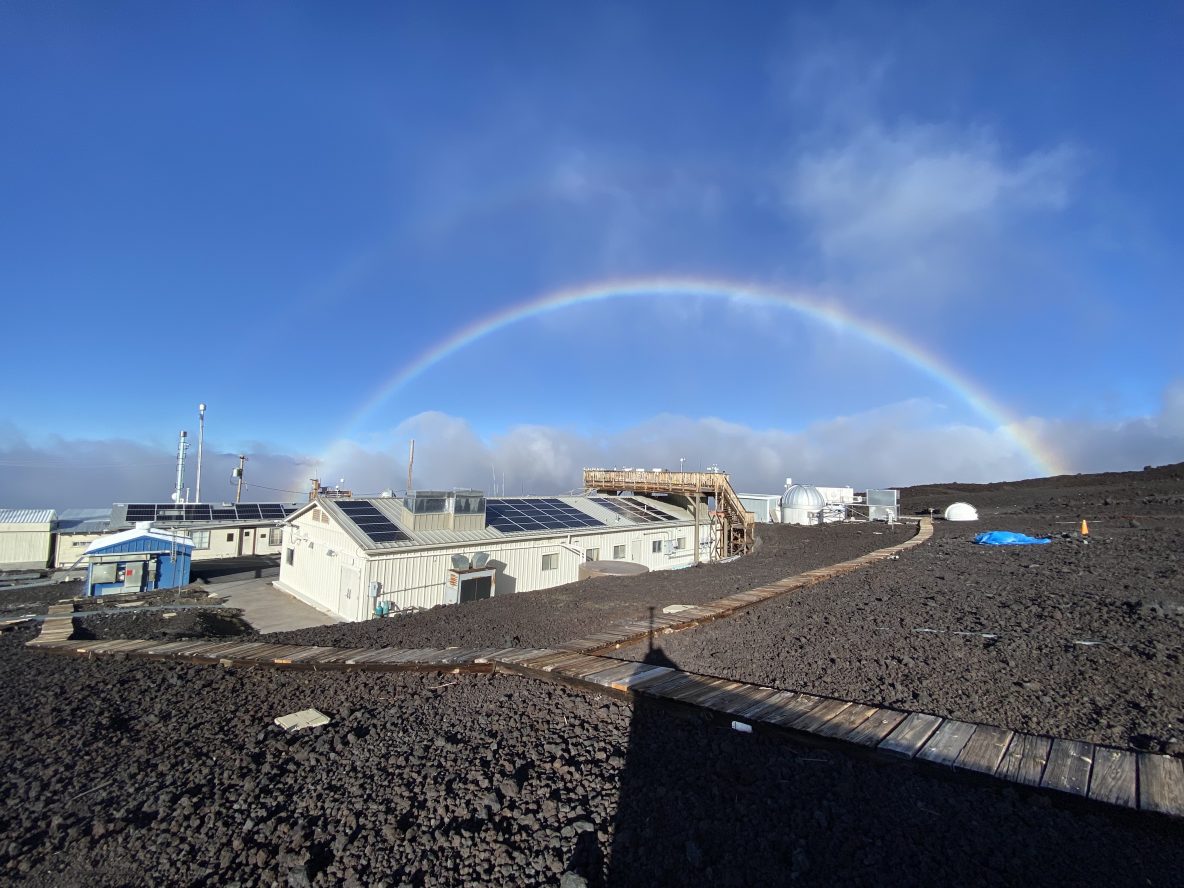
Carbon dioxide is accumulating in the atmosphere faster than ever — accelerating on a steep rise to levels far above any experienced during human existence, scientists from NOAA and Scripps Institution of Oceanography at the University of California San Diego announced today. Scientists at Scripps Oceanography, which initiated the CO2 monitoring program known as the Keeling Curve at Mauna Loa in 1958 and … Read More
Largest Year–Over-Year Gain in Keeling Curve Set in March
New record for largest 12-month gain in carbon dioxide concentration ever observed The monthly average concentration of carbon dioxide in the atmosphere measured at NOAA’s Mauna Loa Observatory in March 2024 was 4.7 parts per million (ppm) higher than that recorded in March 2023, setting a new record and revealing the increasing pace of CO2 addition to the atmosphere by … Read More
Brief Reprieve from 400 PPM Era May Be Thanks to a Hurricane
A hurricane bearing down on Hawaii prompted operators to shut down CO2 monitoring equipment at Mauna Loa Observatory on the Big Island.
Record Annual Increase of Carbon Dioxide Observed for 2015
CO2 levels increasing at a faster rate than before
American Chemical Society to Honor Keeling Curve in June 12 Ceremony
Scripps Oceanography lab monitoring atmospheric CO2 named National Historic Chemical Landmark
What Does This Number Mean?

Repost of April 2013 entry The Mauna Loa carbon dioxide (CO2) record, also known as the “Keeling Curve,” is the world’s longest unbroken record of atmospheric carbon dioxide concentrations.
A Keeling Curve Funding Update – April 2015
The Scripps Institution of Oceanography, UC San Diego O2 and CO2 programs have received funding from multiple sources that put these operations on a relatively secure footing for the next few years.
Is the Rate of CO2 Growth Slowing or Speeding Up?
The rate of growth in carbon dioxide concentrations in the atmosphere has accelerated since the beginnings of the Keeling Curve.
As Told by the American Museum of Natural History…
The story of the Keeling Curve is beautifully animated in this new video. The American Museum of Natural History will host a Google+ Hangout Sept. 9, 2014 on the topic of the Keeling Curve. [youtube https://www.youtube.com/watch?v=0Z8g-smE2sk&w=560&h=315]
- Page 1 of 2
- 1
- 2