Peak carbon dioxide levels surpass 411 parts per million for May
Record Annual Increase of Carbon Dioxide Observed for 2015
CO2 levels increasing at a faster rate than before
Is This the Last Year Below 400?
Leader of Keeling Curve measurement says temporary bump from El Niño could push atmospheric CO2 levels above symbolic threshold for good
American Chemical Society to Honor Keeling Curve in June 12 Ceremony
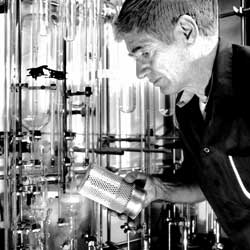
Scripps Oceanography lab monitoring atmospheric CO2 named National Historic Chemical Landmark
What Does This Number Mean?
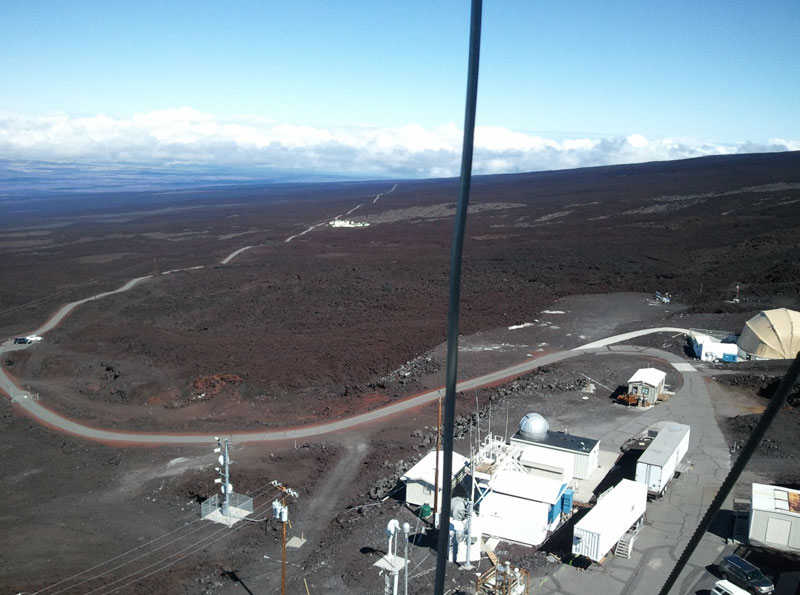
Repost of April 2013 entry The Mauna Loa carbon dioxide (CO2) record, also known as the “Keeling Curve,” is the world’s longest unbroken record of atmospheric carbon dioxide concentrations.
Is the Rate of CO2 Growth Slowing or Speeding Up?
The rate of growth in carbon dioxide concentrations in the atmosphere has accelerated since the beginnings of the Keeling Curve.
How are CO2 Data Processed?
Scientists make CO2 measurements in remote locations to obtain air that is representative of a large volume of Earth’s atmosphere and relatively free from local influences that could skew readings.
Why Don’t Global Surface Temperature Trends Match Atmospheric CO2 Increases?
Question submitted to Scripps Oceanography science magazine explorations now by Ruben M., Watsonville, Calif. Great question Ruben! The surface temperature we experience every day is not expected to perfectly track CO2 because CO2 isn’t the only factor driving climate change. Still, it is quite an important factor, and the overall rise in temperature does roughly follow the overall rise in CO2. … Read More
Why Does Atmospheric CO2 Peak in May?
Tim Lueker, research scientist in the Scripps CO2 Research Group, only needs one sentence to explain why atmospheric CO2 peaks in May.
- Page 1 of 2
- 1
- 2


