
Repost of April 2013 entry
The Mauna Loa carbon dioxide (CO2) record, also known as the “Keeling Curve,” is the world’s longest unbroken record of atmospheric carbon dioxide concentrations.
This record, from the NOAA-operated Mauna Loa Observatory, near the top of Mauna Loa on the big island of Hawaii, shows that carbon dioxide has been increasing steadily from values around 317 parts per million (ppm) when Charles D. Keeling began measurements in 1958, to nearly 400 ppm today.
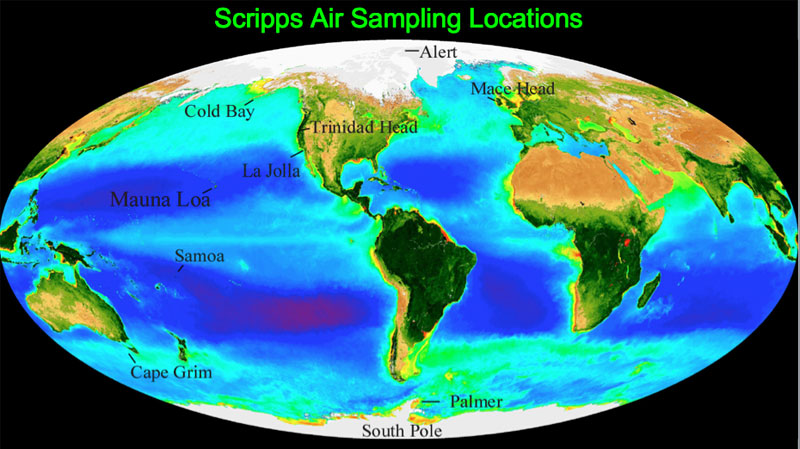
Scientists make CO2 measurements in remote locations to obtain air that is representative of a large volume of Earth’s atmosphere and relatively free from local influences that could skew readings. The quality of data is verified before daily average values are determined.
Concentrations are currently approaching the symbolically important value of 400 parts per million. The continued rapid rise in CO2 ensures that levels will rise far beyond 400 ppm before they stabilize. If the pace of the last decade continues, carbon dioxide will reach 450 ppm by the year 2040. Carbon dioxide is the most important man-made greenhouse gas, produced mainly by the burning of fossil fuels such as coal, oil and natural gas. The pace of rise depends strongly on how much fossil fuel is used globally.
Although the Mauna Loa record extends back only 55 years, a record extending 800,000 years has been obtained from samples of old air preserved as bubbles in the Antarctic ice sheet. These records from the Antarctic ice sheet are referred to as ice-core records of atmospheric carbon dioxide and two ice-core studies have been used to create the figures on the front page showing atmospheric carbon dioxide before the Mauna Loa record. The reference for the ice-core record extending back 800,000 years is: Lüthi, D., et al. 2008. High-resolution carbon dioxide concentration record 650,000-800,000 years before present. Nature, Vol. 453, pp. 379-382. doi:10.1038/nature06949 The reference for the ice-core record extending back 2,000 years is: MacFarling Meure, C., et al. 2006. The Law Dome CO2, CH4 and N2O Ice Core Records Extended to 2000 years BP. Geophysical Research Letters, Vol. 33, No. 14, L14810 10.1029/2006GL026152. These data sets can be accessed from the Carbon Dioxide Information Analysis Center (CDIAC), Oak Ridge National Laboratory, U.S. Department of Energy.
Prior to the Industrial Revolution, natural climate variations caused atmospheric CO2 to vary between about 200 ppm during ice ages and 300 ppm during the warmer periods between ice ages. At the dawn of the Industrial Revolution, around the year 1780, the CO2 concentration was about 280 ppm, so CO2 had already risen by around 40 ppm before Keeling began his measurements. Anyone who has breathed air with less than 300 ppm CO2 is now over 100 years old! An even longer but much less accurate record of atmospheric CO2 can be obtained using other geochemical methods. These suggest that the last time atmospheric CO2 was over 400 ppm was at least as far back as the Pliocene, three to five million years ago, before humans roamed the earth and when the climate was considerably warmer than today.
This website provides daily updates, analysis, and information on the state of climate. Follow @Keeling_curve to get daily updates of the CO2 value. Through this site, the public can also help support the continuation of the iconic Keeling Curve and of complementary measurements of atmospheric oxygen made at Scripps. These measurements enable society to witness climate change and inform strategies to address it. Click below to go to the UC San Diego giving fund set up specifically to fund ongoing operations.
![]()